


STAFF
COMPOSITION
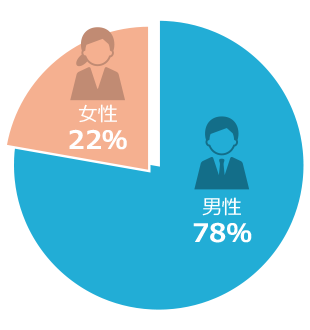
人数構成(全体437名)
■男女比率
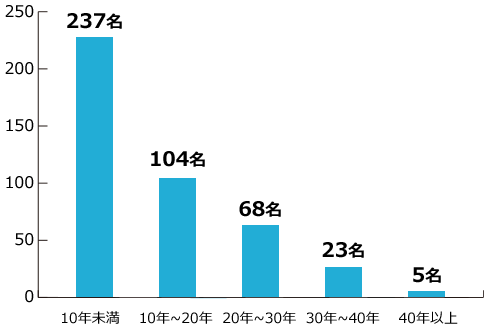
■勤続年数別人数
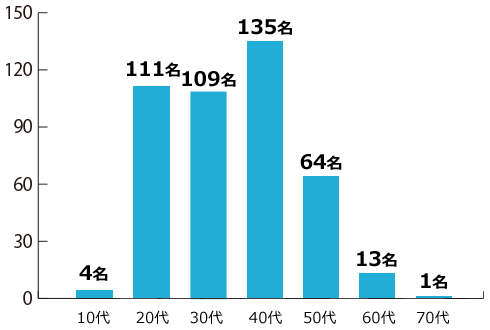
■世代比率
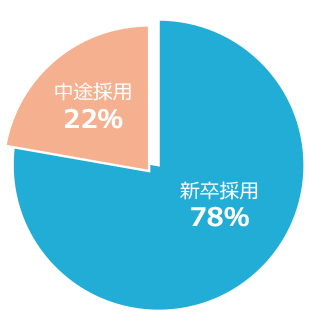
■新卒採用/中途採用比率
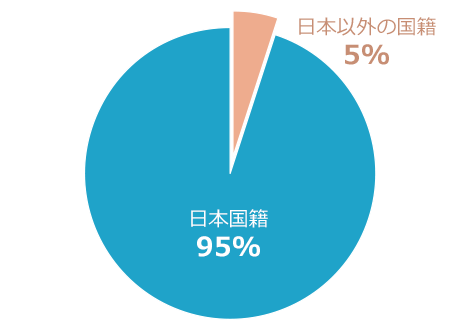
■外国人比率
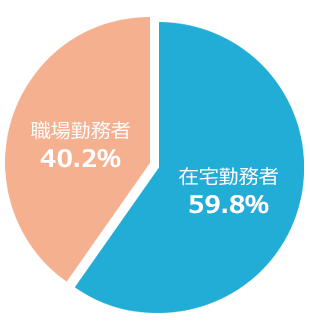
■在宅勤務者比率
■直近3事業年度の、採用した正規雇用労働者の男女別・年齢階層別の中途採用数
| 2022/11- 2023/10 |
20代 | 30代 | 40代 | 50代 | 60代 | 全体 |
|---|---|---|---|---|---|---|
| 男性 | 5人 | 2人 | 3人 | 2人 | 2人 | 14人 |
| 女性 | 2人 | 2人 | 0人 | 1人 | 0人 | 5人 |
| 2023/11- 2024/10 |
20代 | 30代 | 40代 | 50代 | 60代 | 全体 |
|---|---|---|---|---|---|---|
| 男性 | 8人 | 1人 | 5人 | 1人 | 0人 | 15人 |
| 女性 | 2人 | 3人 | 3人 | 0人 | 0人 | 8人 |
| 2024/11- 2025/10 |
20代 | 30代 | 40代 | 50代 | 60代 | 全体 |
|---|---|---|---|---|---|---|
| 男性 | 4人 | 2人 | 2人 | 2人 | 0人 | 10人 |
| 女性 | 2人 | 2人 | 0人 | 1人 | 0人 | 5人 |